
Table of Contents
Uncertainty analysis - Tutorial
(Work in progress)
In this tutorial you will perform an uncertainty study on the fruit tree model. The goal is to find out how PCP101 is taken up via root uptake by apple trees.
You will learn
- How to describe the uncertainty in parameters by assigning probability density functions (PDFs)
- How to use the editor to select a PDF and how to calculate some simple statistics on the distribution
- How to make prepare for the simulation:
- Selecting number of iterations and sampling scheme
- Selecting parameters to include in the study
- Selecting time points and outputs
- How to run a probabilistic simulation
- How to create plots and tables for probabilistic results
- How to create tables for probabilistic results
Prerequisites
Creating the model
- Create a new project in the info screen using a blank template.
- In the model screen, add Food>Terrestrial food>Fruit tree.
- In the context screen
- Select the contaminant PCB101
- Rename the Fruit (in Food) from “Fruit” to “Apple”
- In the time series screen assign the following values
Concentration in soil
Material: PCB101
| Time(d) | Value (mg kg dw-1) |
|---|---|
| 0 | 1 |
Actual evapotranspiration
| Time(d) | Value (mm d-1) |
|---|---|
| 0 | 50 |
Temperature of air
| Time(d) | °C |
|---|---|
| 0 | 15 |
Assigning PDF's
The information we have about the distribution of possible values for a parameter is described using a PDF. Common PDF's include the normal distribution, the uniform distribution and their logarithmic counterparts (lognormal, loguniform), but there are many others.
Almost all probability density functions require some information from you. Some distributions allow you to provide the same information but using different information sets; the normal distribution can be defined using either the mean + standard deviation or by entering two percentiles.
The written representation of a PDF is name(arg1=x, arg2=y). It can be difficult to remember the name of all the functions and their arguments. Therefore it is more common to use the editor when entering PDFs. The PDF editor appears when you click a field which requires a distribution.
 We will now use the PDF editor to change the probability distribution of a parameter, and to perform some basic calculations on the distribution.
- Go to the parameters screen
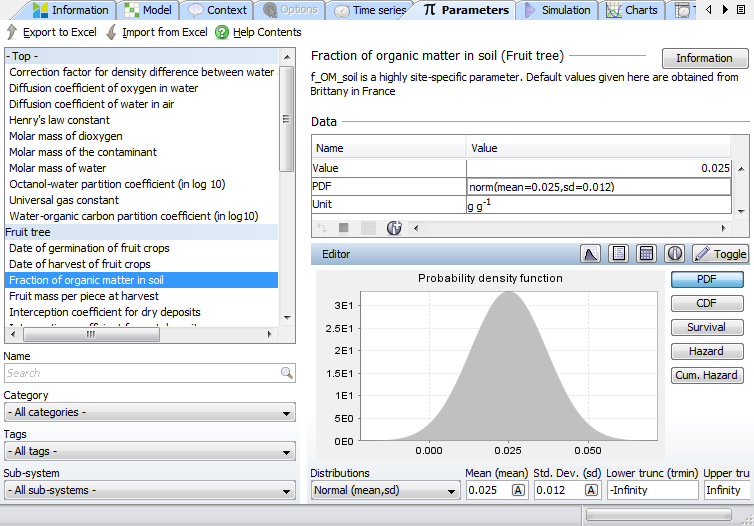
- In the list of parameters, select the parameter Fraction of organic matter in soil. The Data table will now display the values of the parameter. The PDF for the parameter is a normal distribution with a mean value of 0.025 and a standard deviation of 0.012.
- Click the PDF field to bring up the PDF editor.
The familiar bell shape of the normal distribution is displayed in the editor. The buttons on the left allow you to change the graph to, instead of the PDF, show the CDF, survival function, hazard function or cumulative hazard function.
The PDF Editor has some tools you can use to perform some statistical calculations on the function.
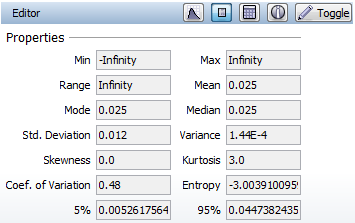
Properties
The properties tool will show you statistical information about the on the currently selected function.
- Click the
 button.
 - What is the 5th percentile?
Calculator
The calculator tool let you make some quick calculations using the selected function.
- Click the
 button
 - In the X2 field, enter the value 0.03
- What is the percentile of X2?
- In the X1 field, enter the value 0.0
- What is the percentile of X1?
- What is the probability that a value sampled from the distribution is below 0? (P(X<X1))
 You will see that this distribution actually includes negative numbers. This is no good, a negative fraction would likely confuse fruit scientists and MERLIN-Expo both.
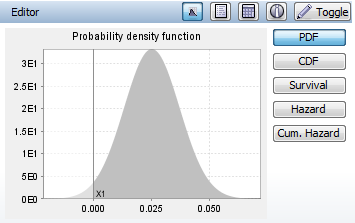
- Return to the chart by clicking the

The chart tool highlights the percentiles entered in the calculation tool.
Information
 Describes the currently selected function and it’s parameters.