
Table of Contents
Introduction
This is part 3 of the silly tutorial creating an aquatic food web. In part 1 we started with a simple invertebrate model. In part 2 we added fish and river for them to live in.
If you jumped straight into part 3, you can cheat by downloading this file.
We can now estimate the lead concentration in the diet of the soldiers (dying on the beaches of the river Glein). This diet we can plug into a model for a human being.
You will learn:
- How to use the human intake model and how to bend arrows.
- How to select simulation outputs.
- How to create tables.
- How to use the man model and the interaction matrix
Human intake
The human intake model aggregates sources of contamination for a human being (concentrations in air, dust and soil, food items etc.) and calculates the net exposure to an individual through ingestion and inhalation.
- In the
 model screen, add Human exposure > Human intake > Human intake.
 - When asked if you want to connect it to the other models, say Ok.
Organising the graph
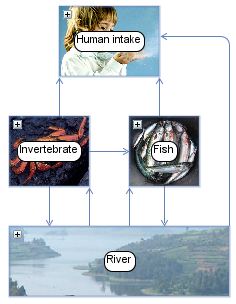 You should now see what eventually happens when boxes are connected - the arrows cross no matter how you move the boxes. Let try to solve it.
- Move the mouse cursor to one of the lines. The cursor changes
 . Right-click, and choose Add waypoint from the menu, or
 - Press and hold the SHIFT key. Move the mouse to the line. A + sign should appear on the mouse cursor. Click the left mouse button to add the waypoint.
A small box should now have appeared on the line, which can be moved around to make the line bend and shift.
To remove a waypoint:
- Right-click the anchor and choose Remove waypoint from the menu, or
- Press the SHIFT key. Move the mouse to the waypoint. A - sign should appear. Click the left mouse button to remove the anchor.
Adding chips
Studies from a archaeologists have revealed that another potential exposure route for the soldiers might have been their heavy chips eating habit. As potato had not yet been introduced in Britain, we must assume that the chips were imported. We have no way (or interest) in modelling the lead concentration in chips but we would be careless to exclude this potential pathway.
- Go to the
 Context window and the Food section.
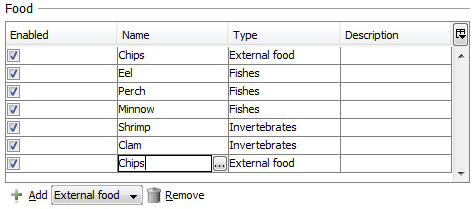 The human intake model should have given you new options in the drop down list next to the
  Add button. It contains all kinds of food types which can be modelled by MERLIN-Expo (leaf, fruit, grain etc.). For food types that should not be modelled, you should use External food.
- Add one external food item. Name it “Chips”.
Chips concentration
- Go to the time series screen.
The human intake model asks for several concentrations. Some of these can be calculated by other MERLIN-Expo models.
We will assume that the lead concentration in chips stays the same during the entire simulation time.
- Enter the following value
Concentration in external food
Material: Lead, External food: Chips
| Time | Value (mg kgfw-1) |
|---|---|
| 0 | 0.2 |
Diet
The parameters screen allows us to describe the diet of a soldier through the parameter Ingestion rate for different types of food. All types of invertebrates and fish appear here, the ones that aren't consumed by humans we can ignore by putting zeroes. The soldiers also sometimes drink river water. Did you notice the arrow from River to Human intake in the graph? You can specify how much unfiltered river water the soldiers drink with the parameter Ingestion rate for different types of liquids. We will resist the temptation to enter ingestion rates for when soldiers bite the dust.
Ingestion rate for foods
| Food | Value (kg.fw d-1) |
|---|---|
| Shrimp | 0.03 |
| Clam | 0.04 |
| Eel | 0.02 |
| Perch | 0.4 |
| Minnow | 0.0 |
| Chips | 0.5 |
Ingestion rate for liquids
| Food | Value (L d-1) |
|---|---|
| Water | 0 |
| Milk | 0 |
| Unfiltered water | 0.5 |
Selecting simulation outputs
For each model a few outputs have been selected for you. If you are interested in seeing results of intermediate calculations or your inputs, you must specify them.
- In the simulation screen, click the
 Simulation Settings button and proceed to the Outputs tab. All available outputs are listed on the left hand side and all selected outputs are listed on the right hand side.
As you can see, there is quite a lot inside each of the model boxes. Just to make sure that everything is set up ok we want to see exactly what goes into the human intake model and what leaves it.
- Locate the Human intake folder
- Select the items listed below. Click the > button to move them to the selected area.
| Human intake |
|---|
| Concentration in external foods |
| Concentration in fish |
| Concentration in foods |
| Concentration in invertebrates |
| Concentration in liquids |
| Concentration in river water |
| Fraction of total quantity ingested from foods |
| Fraction of total quantity ingested from liquids |
| Quantity ingested from foods |
| Quantity ingested from liquids |
Simulation
- Run a simulation.
Tables
If you want numbers from a simulation, tables are much better than plots. Go to the  tables screen.
The tables screen is very similar to the charts screen. After a normal simulation, two types of tables are available.
- Time table - For time dependent data, shows one row for each time point and one column for each output.
- Material table - For any data. The time point is fixed, by default you get the last time point of the simulation.
In order to make life a little easier, turn off automatic table creation:
- Right click the left hand list
- Unselect Toggle auto-create tables
Next display the dependencies for each output
- Right click the left hand list
- Select Show/hide dependencies
 Let us begin by making sure that the concentrations look ok:
- Open the node with today's date, then the Human intake node.
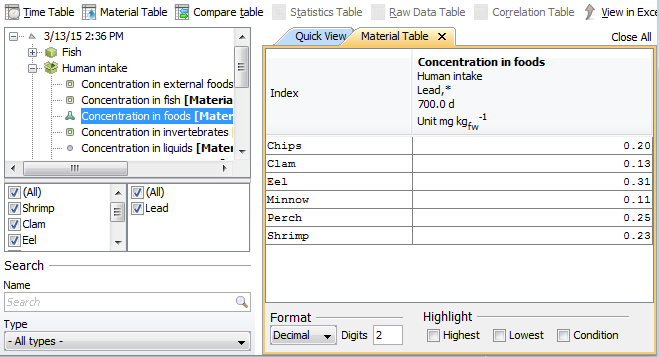
- Select Concentration in foods.
- In the list below, select (All) food types
- Click the
 Material Table button in the toolbar.
 - A table is created. Below the table, change the Format from Scientific to Decimal.
- Compare your values with the picture to the right →.
Ingestion rate
The total quantity (of lead) ingested, as well as the different quantities (of lead) ingested from different foods can be found in the outputs of Human intake. There is also an output for the fraction for the contribution from each food type to the total ingested quantity (Fraction of total quantity ingested from food).
Which of the food type(s) would you tell the soldiers to avoid?
Adding humans
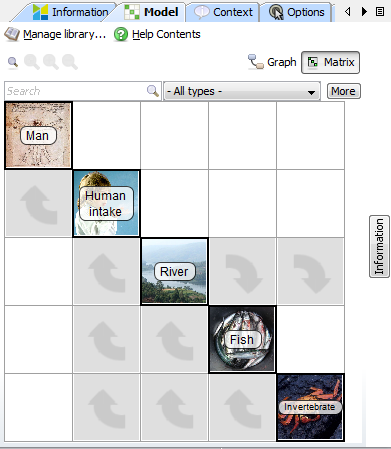
Matrix
Return to the model screen. As you continue to add boxes, there will be a time when the game "don't cross the line" will drive you mad. This is when you might consider using the interaction matrix instead of the graph.
In short, the interaction matrix is like a graph but where the boxes are all on the diagonal. The “arrows” are put in the off-diagonal cells in a clock-wise order, so that a connection from box A to box B is put on the same row as A and in the same column as B.
You switch to the interaction matrix by clicking the Matrix button. Note that you can jump back and forth between these, an update in the graph will reflect in the matrix and vice versa.
Accessing the library
We have everything set up for adding our soldier. If we wanted to study several soldiers (footmen, spearmen, knights etc.) we can do so using the population model but to keep things simple we will study just one individual.
Adding a Man model
- In the matrix, right click the empty diagonal cell after Invertebrate.
- Add Human exposure > Man > Man and let the tool connect it with the human intake model.
Re-arraning the matrix
- Move the Man model to the top left of the matrix.
- Right click the first of the remaining empty cells. Keep SHIFT pressed on your keyboard and click the very last cell in the matrix, so that all the empty cells are selected. Press the DELETE key on your keyboard, or right click and choose Delete from the menu.
- Make sure that Information is displayed on the right hand side and select the off diagonal cell (arrow) from Human intake to Man. You see here that the total quantity ingested (Qing,rate) that we computed in the Human intake model is passed on to the Man model.
Initial age
The man model offer a long list of parameters, most of which you should not touch. An important parameter is Age at the beginning of the simulation. The age is used to calculate a lot of things about the body; the body weight, the breathing frequency, the cardiac output etc.
Enter the following value:
Age at the beginning of the simulation
| Value (year) |
|---|
| 18 |
Blood concentrations
- Run a new simulation
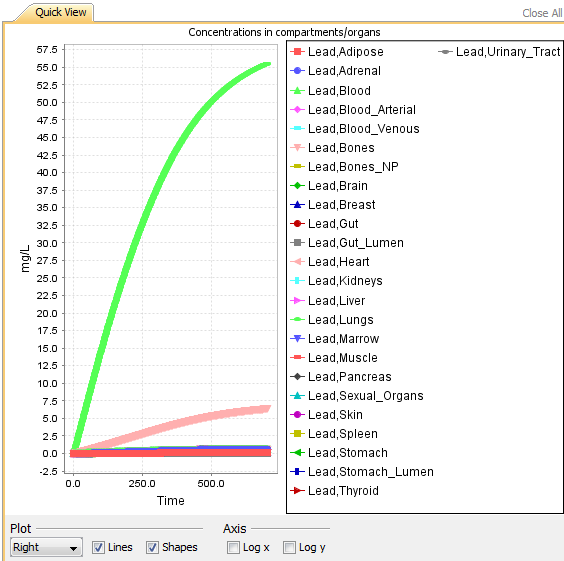
- In the charts screen, create a plot of the lead concentration in blood. Do you think our soldier should see a doctor?
If you want to compare your model with ours, download this.