
Table of Contents
Getting started
This brief tutorial will get you acquainted with the MERLIN-Expo user interface and philosophy. We will cover the different steps taken when using MERLIN-Expo for a study, from setting up the model to entering data to running simulations to inspecting results.
For this tutorial we will study acute lead poisoning of children. A family with a 4 year old daughter are re-painting their house. The daughter sits on the ground and eats paint chips that she finds in the grass.
Creating a project for the study
- In the info screen, click the
 New button. In the window that appears, choose the blank (empty) template.
- Your name should appear in the Author field. If it doesn't, enter it yourself.
Creating the model
What makes MERLIN-Expo unique is its flexibility. MERLIN-Expo ships with a library of sub-systems that you can combine to quickly create a model for a specific scenario. In this example we need only one sub-system - a human sub-system.
The model screen displays the (mathematical) model for your study. As you have chosen a blank template, it is initially empty.
The library is accessed by right-clicking the white area and choosing Add from library… from the menu that appears.
- Go to the model screen.
- Right-click the large white area.
- Choose Get from library… from the popup menu.
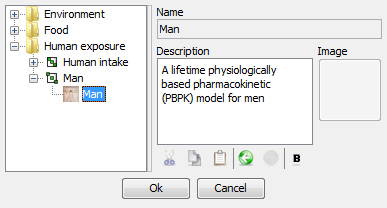
- In the window, open the Human exposure folder. Expand the Man node and select the Man model inside it.
- Click Ok
A box for a human being should now appear. To look inside the box, either
- click the + symbol to look inside, or,
- select Man from the drop down list above (it says -Top-)
 To see the equations used in the model you need the information panel.
- Right-click the vertical Information button on the right hand side of the screen.
- Select a box or arrow inside the model.
The information panel should now display information about the selected object. You can click anything in blue to navigate between the model objects.
Context
The context screen is used to select which contaminant(s) you are studying. Some sub-systems let you define food items that are produced or list types of individuals that you are studying.
- In the list of contaminants, select Lead. It should now move from the Available to the Selected list.
Options
The options screen let you tweak the model. Different sub-systems offer different options - some offer none. The Man model gives you two options. We will look at (not change) one of them.
- Go to the options screen
- In the list, select Ingestion
A description of this option is now presented on the right hand side. This option allows you to specify which route a contaminant takes when being ingested. As different contaminants can take different route, you need to select Lead from the drop down list.
- In the drop-down list below the Target label, change from Default to Lead
- Make sure that Ingestion via the liver is selected.
Entering input concentrations
Lead can enter the body either via inhalation or via ingestion. The time series screen let you enter time dependent inputs to the model. These are typically measurements (concentrations, rain, temperature, etc.).
Time series' always start at day 0 (because this is when the simulation is set to start).
We want to enter a step function for ingestion were the kid eats 1 grams of lead during a 24 hour period:
- Select rate of the amount of contaminant ingested in the list.
- Above the table, change Materials from Default to Lead.
- Enter the following values into the table
| Time (d) | Value (mg/d) |
|---|---|
| 0 | 1000 |
| 1 | 0 |
The Editor below should now display a curve with a peak at day 0. The x-axis shows the full time span of the simulation, which by default is 365 days. You should zoom in to make sure everything looks ok:
- In the editor, click somewhere close to the peak. While the mouse button is pressed, drag a blue outline over the peak as shown in the picture.
When looking closely, you should see that the curve is actually not a step - it is a tilted line. This is because the ingestion rate data is linearly interpolated.
- Above the table, change Interpolation from Interpolation-Extrapolation to Use Input Below. The curve should now change to a step function.
Parameter data
Values which remain constant during the simulation are entered in the parameters screen. For the body, we only want to change one parameter; the age of the person we study. As the simulation progress, the person will grow, so the we can only enter the initial age of the person.
- Go to the parameters screen.
- In the list, select Age at the beginning of the simulation
- In the table, enter the value 4 (years).
Running a simulation
The simulation screen lets you select what outputs (end-points or intermediary calculations) and for what time points you want data, what type of simulation you want to run etc.
- Change the End time to 100 days.
- Click the
 Run button to start the simulation.
The Information will keep you informed about simulation progress.
Analysing results
The charts screen and the tables screen lets you create plots and tables of simulation results. You can also export your results if you want to create proper plots/tables or perform post processing in another software such as Excel.
These two screens are very similar. After a simulation has been run, the available simulation outputs are listed on the left hand side, organised into folders. When you select an output which has values for different contaminants, types of food, etc., a panel appears that let you continue to select exactly which dependencies you want to plot. After, click one of the toolbar buttons to create different types of charts/tables.
- Go to the charts screen
- In the list, open the node with today's date and the Man folder inside it.
- Click the output Concentrations in compartments/organs
- In the list which appears below, make sure that Lead and Blood are selected.
- Click the Time chart toolbar button.
A chart will now reveal the blood concentrations of the child.
The World Health Organisation lists the following effects for children that have been exposed to lead:
| Blood concentration (µg/L) | Effect |
|---|---|
| >1000 | Death |
| 500-1000 | Encephalopathy, Nephropathy, Frank anemia, Colic |
| 250-500 | Decreased hemoglobin synthesis, Increased vitamin D metabolism, increased risk of hypertension in adulthood |
| 100-250 | Increased nerve conduction velocity, increased level of erythrocyte protoporphyrin, decreased vitamin D metabolism, decreased calcium homeostasis |
- Is the child in trouble?
Tables
To get the exact concentration a table is better.
- Go to the tables screen.
- Like before, select concentration of lead in blood
- Click the Time table button
A table with the blood concentrations should now appear. If you have Excel installed on your computer, you can view the data directly in Excel:
- Right-click the table
- Choose View in Excel from the menu
Otherwise, if you do not have Excel or if the above failed,
- Right-click the table
- Choose Export > Excel… or Export > Tab separated text…
Generating a report
If you want to get a better understanding of the model you can generate a report. The report contain all equations and data that you have entered, the simulation settings and plots and tables you have created. Exactly what is displayed in the report can be fine tuned.
- Go to the report screen
- Click the Refresh button to generate the report
- Click the Settings button to select the contents and appearance.
- Click the Generate and open PDF to export the report into an Adobe Acrobat Reader file.